Wahlkreis Chorley
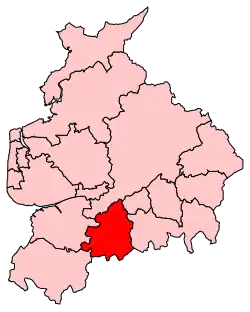
Chorley ist ein Wahlkreis für das britische Unterhaus in der Grafschaft Lancashire. Der Wahlkreis wurde bereits 1885 geschaffen und deckt einen Großteil von Chorley ab. Er entsendet einen Abgeordneten ins Parlament.
Geschichte
Der Wahlkreis wurde von 1885 bis 1945 durchgehend von Angehörigen der Conservative Party vertreten. Seither wechseln sich diese und die Labour Party in größeren Abständen ab. Zwischen 1895 und 1913 repräsentierte David Lindsay, 27. Earl of Crawford den Wahlkreis. Seit den Unterhauswahlen 1997 wird Chorley von Sir Lindsay Hoyle, welcher seit 2010 als Deputy Speaker amtierte und 2019 zum Speaker des House of Commons gewählt wurde, im Parlament vertreten.
Ergebnisse (seit 1945)
Parlamentswahl 1945
| Kandidaten | Parteien | Stimmen | % | |
|---|---|---|---|---|
| Clifford Kenyon | Labour Party | 24.550 | 53,2 | |
| Robert Hamilton Brown | Conservative Party | 21.595 | 46,8 | |
| Gesamt | 46.145 | 100 | ||
| Quelle: UK Parlament | ||||
Parlamentswahl 1950
| Kandidaten | Parteien | Stimmen | % | |
|---|---|---|---|---|
| Clifford Kenyon | Labour Party | 23.233 | 47,6 | |
| Andrew Fountaine | Conservative Party | 22.872 | 46,9 | |
| Florence Emilie Adams | Liberal Party | 2.706 | 5,5 | |
| Gesamt | 48.811 | 100 | ||
| Quelle: UK Parlament | ||||
Parlamentswahl 1951
| Kandidaten | Parteien | Stimmen | % | |
|---|---|---|---|---|
| Clifford Kenyon | Labour Party | 24.771 | 50,7 | |
| Alfred Hall-Davis | Conservative Party | 24.118 | 49,3 | |
| Gesamt | 48.889 | 100 | ||
| Quelle: UK Parlament | ||||
Parlamentswahl 1955
| Kandidaten | Parteien | Stimmen | % | |
|---|---|---|---|---|
| Clifford Kenyon | Labour Party | 24.994 | 51,4 | |
| Alfred Hall-Davis | Conservative Party | 23.656 | 48,6 | |
| Gesamt | 48.650 | 100 | ||
| Quelle: UK Parlament | ||||
Parlamentswahl 1959
| Kandidaten | Parteien | Stimmen | % | |
|---|---|---|---|---|
| Clifford Kenyon | Labour Party | 25.641 | 50,7 | |
| Frank Taylor | Conservative Party | 24.965 | 49,3 | |
| Gesamt | 50.606 | 100 | ||
| Quelle: UK Parlament | ||||
Parlamentswahl 1964
| Kandidaten | Parteien | Stimmen | % | |
|---|---|---|---|---|
| Clifford Kenyon | Labour Party | 24.710 | 48,4 | |
| John Sutcliffe | Conservative Party | 20.997 | 41,1 | |
| Alistair Bell | Liberal Party | 5.331 | 10,4 | |
| Gesamt | 51.038 | 100 | ||
| Quelle: UK Parlament | ||||
Parlamentswahl 1966
| Kandidaten | Parteien | Stimmen | % | |
|---|---|---|---|---|
| Clifford Kenyon | Labour Party | 27.319 | 54,8 | |
| Constance Monks | Conservative Party | 22.575 | 45,2 | |
| Gesamt | 49.894 | 100 | ||
| Quelle: UK Parlament | ||||
Parlamentswahl 1970
| Kandidaten | Parteien | Stimmen | % | |
|---|---|---|---|---|
| Constance Monks | Conservative Party | 26.577 | 47,3 | |
| Derek Forwood | Labour Party | 24.900 | 44,3 | |
| Gordon Payne | Liberal Party | 4.428 | 7,9 | |
| Barry Elder | Anti-Party | 334 | 0,6 | |
| Gesamt | 56.239 | 100 | ||
| Quelle: UK Parlament | ||||
Parlamentswahl Februar 1974
| Kandidaten | Parteien | Stimmen | % | |
|---|---|---|---|---|
| George Rodgers | Labour Party | 25.440 | 40,3 | |
| Constance Monks | Conservative Party | 25.035 | 39,7 | |
| Neva Orrell | Liberal Party | 12.652 | 20,0 | |
| Gesamt | 63.127 | 100 | ||
| Quelle: UK Parlament | ||||
Parlamentswahl Oktober 1974
| Kandidaten | Parteien | Stimmen | % | |
|---|---|---|---|---|
| George Rodgers | Labour Party | 27.290 | 44,1 | |
| Barry Porter | Conservative Party | 24.577 | 39,7 | |
| Neva Orrell | Liberal Party | 9.831 | 15,9 | |
| Harold Smith | Campaign for a More Prosperous Britain | 185 | 0,3 | |
| Gesamt | 61.883 | 100 | ||
| Quelle: UK Parlament | ||||
Parlamentswahl 1979
| Kandidaten | Parteien | Stimmen | % | |
|---|---|---|---|---|
| Den Dover | Conservative Party | 31.125 | 46,8 | |
| George Rodgers | Labour Party | 28.546 | 43,0 | |
| Neva Orrell | Liberal Party | 6.388 | 9,6 | |
| Michael Dean | British National Front | 379 | 0,6 | |
| Gesamt | 66.438 | 100 | ||
| Quelle: UK Parlament | ||||
Parlamentswahl 1983
| Kandidaten | Parteien | Stimmen | % | |
|---|---|---|---|---|
| Den Dover | Conservative Party | 27.861 | 48,3 | |
| Ivan Taylor | Labour Party | 17.586 | 30,5 | |
| Peter O’Neill | Social Democratic Party | 11.691 | 20,3 | |
| Anthony Holgate | The Ecology Party | 451 | 0,8 | |
| Eva Rokas | unabhängig | 114 | 0,2 | |
| Gesamt | 57.703 | 100 | ||
| Quelle: UK Parlament | ||||
Parlamentswahl 1987
| Kandidaten | Parteien | Stimmen | % | |
|---|---|---|---|---|
| Den Dover | Conservative Party | 29.015 | 48,0 | |
| Anthony Watmough | Labour Party | 20.958 | 34,7 | |
| Ian Simpson | Liberal Party | 9.706 | 16,1 | |
| Anthony Holgate | Green Party | 714 | 1,2 | |
| Gesamt | 60.393 | 100 | ||
| Quelle: UK Parlament | ||||
Parlamentswahl 1992
| Kandidaten | Parteien | Stimmen | % | |
|---|---|---|---|---|
| Den Dover | Conservative Party | 30.715 | 47,2 | |
| Raymond McManus | Labour Party | 26.469 | 40,7 | |
| Janet Ross-Mills | Liberal Democrats | 7.452 | 11,5 | |
| Peter Leadbetter | Natural Law Party | 402 | 0,6 | |
| Gesamt | 65.038 | 100 | ||
| Quelle: UK Parlament | ||||
Parlamentswahl 1997
| Kandidaten | Parteien | Stimmen | % | |
|---|---|---|---|---|
| Lindsay Hoyle | Labour Party | 30.607 | 53,0 | |
| Den Dover | Conservative Party | 20.737 | 35,9 | |
| Simon Jones | Liberal Democrats | 4.900 | 8,5 | |
| Anthony Heaton | Referendum Party | 1.319 | 2,3 | |
| Peter Leadbetter | Natural Law Party | 143 | 0,2 | |
| Gesamt | 57.706 | 100 | ||
| Quelle: UK Parlament | ||||
Parlamentswahl 2001
| Kandidaten | Parteien | Stimmen | % | |
|---|---|---|---|---|
| Lindsay Hoyle | Labour Party | 25.088 | 52,3 | |
| Peter Booth | Conservative Party | 16.644 | 34,7 | |
| Stephen Fenn | Liberal Democrats | 5.372 | 11,2 | |
| John Frost | UK Independence Party | 848 | 1,8 | |
| Gesamt | 47.952 | 100 | ||
| Quelle: UK Parlament | ||||
Parlamentswahl 2005
| Kandidaten | Parteien | Stimmen | % | |
|---|---|---|---|---|
| Lindsay Hoyle | Labour Party | 25.131 | 50,7 | |
| Simon Mallett | Conservative Party | 17.506 | 35,3 | |
| Alexander Wilson-Fletcher | Liberal Democrats | 6.932 | 14,0 | |
| Gesamt | 49.569 | 100 | ||
| Quelle: UK Parlament | ||||
Parlamentswahl 2010
| Kandidaten | Parteien | Stimmen | % | |
|---|---|---|---|---|
| Lindsay Hoyle | Labour Party | 21.515 | 43,2 | |
| Alan Cullens | Conservative Party | 18.922 | 38,0 | |
| Stephen Fenn | Liberal Democrats | 6.957 | 14,0 | |
| Nick Hogan | UK Independence Party | 2.021 | 4,1 | |
| Christopher Curtis | unabhängig | 359 | 0,7 | |
| Gesamt | 49.774 | 100 | ||
| Ungültige Stimmen | 148 | 0,3 | ||
| Wähler | 49.922 | 70,3 | ||
| Wahlberechtigte | 70.976 | |||
| Quelle: UK Parlament | ||||
Parlamentswahl 2015
| Kandidaten | Parteien | Stimmen | % | |
|---|---|---|---|---|
| Lindsay Hoyle | Labour Party | 23.322 | 45,1 | |
| Robert Loughenbury | Conservative Party | 18.792 | 36,3 | |
| Mark Smith | UK Independence Party | 6.995 | 13,5 | |
| Stephen Fenn | Liberal Democrats | 1.354 | 2,6 | |
| Alistair Straw | Green Party of England and Wales | 1.111 | 2,1 | |
| Adrian Maudsley | unabhängig | 138 | 0,3 | |
| Gesamt | 51.712 | 100 | ||
| Ungültige Stimmen | 142 | 0,3 | ||
| Wähler | 51.854 | 69,4 | ||
| Wahlberechtigte | 74.679 | |||
| Quelle: UK Parlament | ||||
Parlamentswahl 2017
| Kandidaten | Parteien | Stimmen | % | |
|---|---|---|---|---|
| Lindsay Hoyle | Labour Party | 30.745 | 55,3 | |
| Caroline Moon | Conservative Party | 23.233 | 41,8 | |
| Stephen Fenn | Liberal Democrats | 1.126 | 2,0 | |
| Peter Lageard | Green Party of England and Wales | 530 | 1,0 | |
| Gesamt | 55.634 | 100 | ||
| Ungültige Stimmen | 134 | 0,2 | ||
| Wähler | 55.768 | 73,0 | ||
| Wahlberechtigte | 76.404 | |||
| Quelle: UK Parlament | ||||
Parlamentswahl 2019
| Kandidaten | Parteien | Stimmen | % | |
|---|---|---|---|---|
| Lindsay Hoyle | unabhängig (Speaker) | 26.831 | 67,3 | |
| Mark Brexit-Smith | Conservative Party | 9.439 | 23,7 | |
| James Melling | Green Party of England and Wales | 3.600 | 9,0 | |
| Gesamt | 39.870 | 100 | ||
| Ungültige Stimmen | 1.303 | 3,2 | ||
| Wähler | 41.173 | 53,4 | ||
| Wahlberechtigte | 77.072 | |||
| Quelle: UK Parlament | ||||
Parlamentswahl 2024
| Kandidaten | Parteien | Stimmen | % | |
|---|---|---|---|---|
| Lindsay Hoyle | unabhängig (Speaker) | 25.238 | 74,3 | |
| Mark Tebbutt | Green Party of England and Wales | 4.663 | 13,7 | |
| Ben Holden-Crowther | Democracy for Chorley | 2.424 | 7,1 | |
| Graham Moore | English Constitution Party | 1.007 | 3,0 | |
| Martin Powell-Davies | Trade Unionist and Socialist Coalition | 632 | 1,9 | |
| Gesamt | 33.964 | 100 | ||
| Ungültige Stimmen | 1.198 | 3,4 | ||
| Wähler | 35.162 | 47,0 | ||
| Wahlberechtigte | 74.801 | |||
| Quelle: UK Parlament | ||||